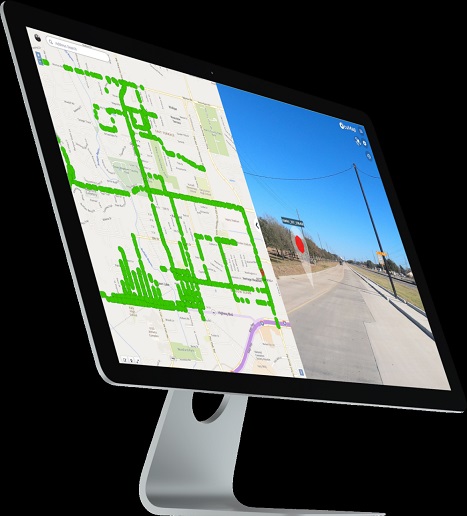
In an increasingly data-driven world, the ability to visualize and understand complex datasets has become crucial for businesses and organizations. Mapping software, particularly interactive mapping software, offers a powerful solution to this challenge by transforming raw data into intuitive, visually appealing maps that reveal patterns, trends, and insights. In this article, we will explore the importance of interactive mapping software, its various applications, and the benefits it brings to different industries.
What is Interactive Mapping Software?
Interactive mapping software is a tool that allows users to create, manipulate, and analyze maps based on spatial data. Unlike static maps, interactive maps enable users to zoom, pan, and click on different elements to uncover more detailed information. This dynamic approach to mapping provides a deeper understanding of the spatial relationships within the data, making it easier to identify trends and make informed decisions.
The Importance of Data Visualization
Data visualization is the process of representing data in a visual context, such as a chart, graph, or map, to make the information more accessible and easier to understand. According to Statista, the global market for data visualization is expected to reach $10.2 billion by 2026, reflecting the growing demand for tools that can help organizations make sense of their data . Interactive mapping software plays a significant role in this market by offering a unique way to visualize spatial data and gain actionable insights.
Applications of Interactive Mapping Software
Interactive mapping software has a wide range of applications across various industries. Here are some key examples:
- Urban Planning and Development
- City planners use interactive mapping software to visualize and analyze urban areas, plan new developments, and assess the impact of proposed changes. By overlaying different data layers, planners can see how factors such as population density, traffic patterns, and land use interact and influence each other.
- Environmental Monitoring
- Environmental scientists use interactive mapping software to track changes in natural landscapes, monitor wildlife habitats, and assess the impact of human activities on the environment. For instance, mapping software can visualize data from sensors monitoring air and water quality, helping scientists identify pollution sources and trends.
- Public Health
- During health crises, such as the COVID-19 pandemic, interactive mapping software has been essential for tracking the spread of disease, identifying hotspots, and allocating resources effectively. Public health officials can visualize infection rates, vaccination coverage, and other critical data to make informed decisions.
- Retail and Marketing
- Businesses use interactive mapping software to analyze customer data, identify market trends, and plan marketing strategies. Retailers can visualize customer demographics, purchasing behavior, and geographic distribution to optimize store locations and targeted marketing campaigns.
- Transportation and Logistics
- Transportation companies use interactive mapping software to plan routes, monitor fleet movements, and optimize logistics operations. By visualizing traffic patterns, delivery routes, and supply chain networks, companies can improve efficiency and reduce costs.
Benefits of Interactive Mapping Software
The benefits of using interactive mapping software are numerous and can significantly enhance the ability to understand and act on spatial data. Here are some key advantages:
- Improved Data Comprehension
- Interactive maps make complex data more accessible and easier to understand. By visualizing data spatially, users can quickly grasp patterns and trends that might be missed in tabular data.
- Enhanced Decision-Making
- Interactive mapping software provides the tools needed to analyze spatial data and make informed decisions. Whether it’s planning a new development, monitoring environmental changes, or optimizing logistics, the insights gained from interactive maps can lead to better outcomes.
- Increased Engagement
- Interactive maps are more engaging than static maps or charts. They invite users to explore the data, ask questions, and uncover insights on their own, leading to a deeper understanding of the information.
- Real-Time Data Integration
- Many interactive mapping software solutions offer real-time data integration, allowing users to see up-to-date information and respond quickly to changes. This is particularly valuable in applications such as public health, transportation, and environmental monitoring.
- Customization and Flexibility
- Interactive mapping software offers a high degree of customization and flexibility, allowing users to tailor maps to their specific needs. Users can choose which data layers to display, adjust the map’s appearance, and create custom filters and queries.

Conclusion
Interactive mapping software is a powerful tool for visualizing and understanding spatial data. Its applications are vast, ranging from urban planning and environmental monitoring to public health and retail. By transforming complex datasets into intuitive, interactive maps, this software enables users to uncover insights, make informed decisions, and engage with the data in a meaningful way.
As the demand for data visualization continues to grow, the adoption of interactive mapping software will likely increase, offering even more advanced features and capabilities. If you’re looking to enhance your data analysis and visualization efforts, investing in interactive mapping software is a smart choice.
Map your infrastructure projects like a pro and boost efficiency by 30% while aligning project stakeholders by 80%. OcuMap supports various file formats and GPS data integration, making it the perfect tool for project managers, GIS experts, city planners, right-of-way engineers, civil engineers, and environmental scientists.


